Ask 10 different people and you’ll get 10 different answers:
- What campaign brings us the best leads?
- Where do new users drop off in the signup process?
- Which marketing channel brings the most revenue?
Integrating metrics across marketing tools often feels like a duct-taped solution. Each platform manages a different stage of the customer journey, resulting in disjointed customer experiences externally, and a lot of pain internally.
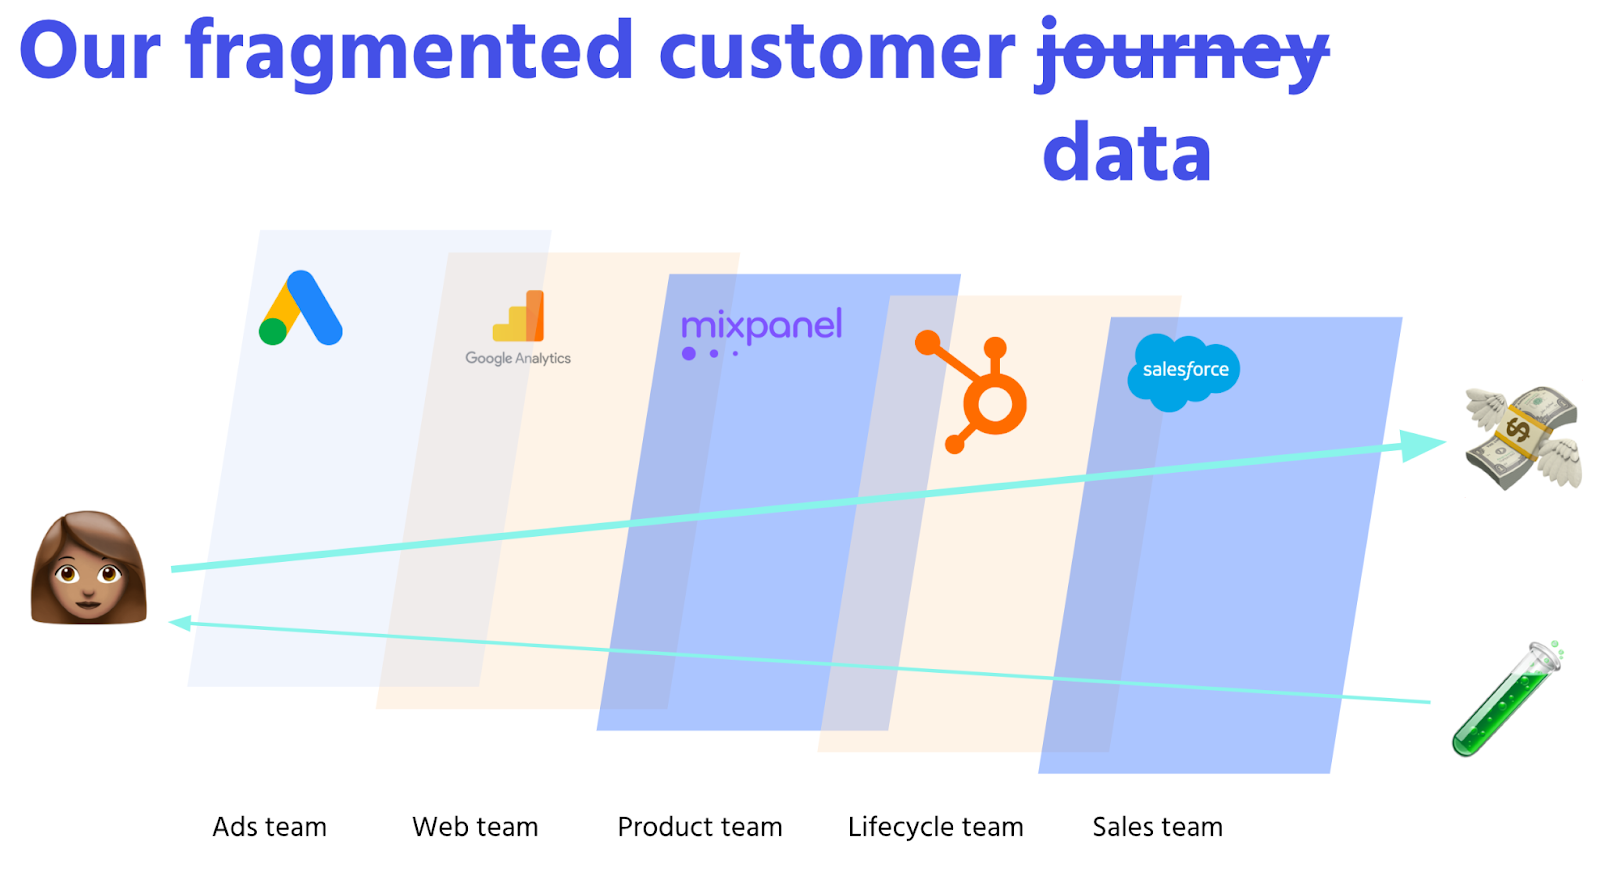
Today we’re excited to announce our integration with Google Analytics! By using the data warehouse as your source of truth, you can define metrics and create models with company-wide data context, and sync those custom dimensions in GA to determine which visitor actions influence your revenue.
👉 For an in-depth guide, listen to the Operational Analytics for Marketing live session where we discuss modeling, scoring, and continuity across marketing metrics.
🚀 What can I do with Census + Google Analytics?
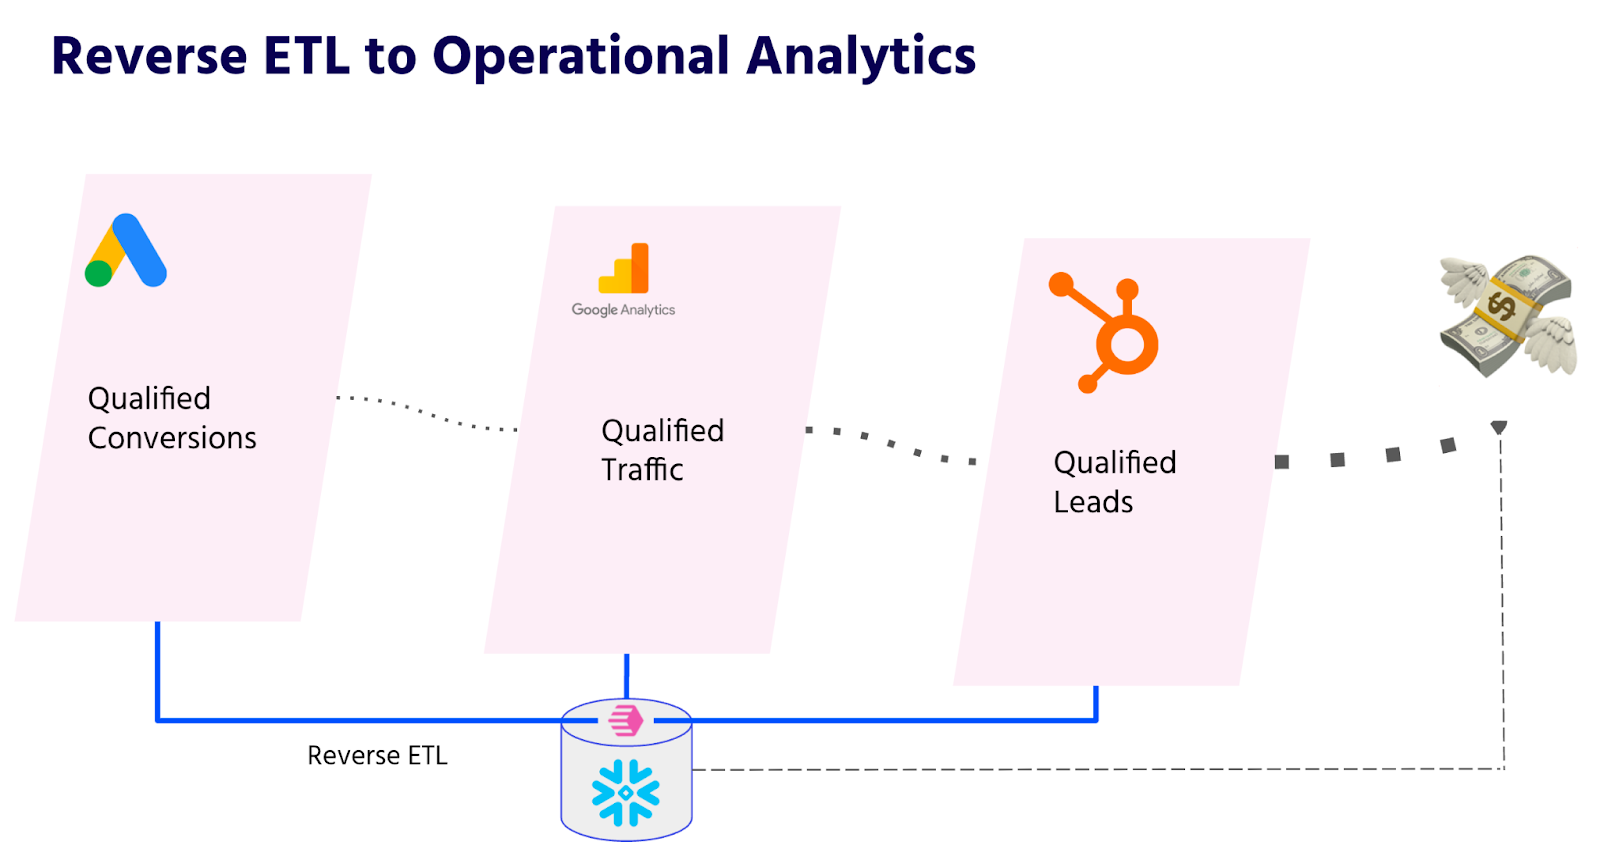
Operational Analytics using reverse ETL helps both data teams and marketing teams unify and sync metrics across all their marketing tools.
1. Evaluate marketing channel effectiveness
🙋 Answer questions like: “Do paid or organic channels have higher quality traffic?”
Our very own Growth Manager, Trevor Fox, uses the Google Analytics integration to evaluate the volume of high-quality traffic a given channel is bringing in. He first enriches visitor domains with Clearbit (a Census customer!) and assigns an account quality score (high/mid/low). Then, he maps that account-based scoring back to traffic sources in GA.
This helps him evaluate our ROI per marketing channel (website, social ads, search ads, etc.) and determine which channels bring in higher proportions of qualified company traffic.
👉 For more details, check out this article by Trevor: Bringing late-stage sales signals into Google Analytics with Census
2. Attribute user properties to revenue
🙋 Answer questions like: “Which ads bring in the most free trial signups?”
Google Analytics captures millions of events including impressions, clicks, and conversions, but it doesn’t help you figure out which actions lead to revenue.
Especially for companies with longer sales cycles, early marketing actions can be hard to attribute to later sales outcomes.
By enriching website visitors with all the data context in your warehouse, you can identify the top prospect actions that correlate with revenue. Combine server-side or offline conversions such as product usage and chatbot activity with website actions like content consumption to continuously refine criteria that indicate high conversion potential.
3. Iterate faster and run big experiments
🙋 Answer questions like: “If I know blog readers from eCommerce companies have high conversion intent, how much revenue will I influence by tripling my Google Ads budget?”
Now that you have a better understanding of your best performing growth levers and marketing channels, you can double down and test your hypotheses at the top of the funnel.
Use Census Segments, our visual audience builder, to quickly build complex segmentation logic without SQL. For example, you can run ads for “only high scoring companies who have been to my product page”, or create lookalike audiences based on top converting customers. Your audiences will always be fresh – new users who match your audience criteria are automatically synced to all your tools.
Even without a perfect attribution or event stream, you can trust your funnel because every metric is a reflection of revenue.
🙌 Benefits of Operational Analytics for marketing

Census’s warehouse-centric approach means experiment analysis and evaluation is consistent across all your tools, because they have the same source model.
For example, you can link account scoring in HubSpot, traffic qualification in Google Analytics, and qualified conversions in Google Ads to get a full picture of the top-of-funnel journey.
OA enables you to design better metrics, apply these metrics appropriately to all the tools in your stack, and improve ROI using all the data in your warehouse.
Interested? Get a demo of Census for marketing operations 🎉
👩🏻💻 What is Google Analytics?
Google Analytics is a free web analytics tool that provides statistics and analytical tools to analyze website traffic and SEO efforts. Given that the website is the central hub of many companies’ digital presences, Google Analytics provides a holistic view of digital marketing effectiveness.
🤝 Census + Google: Better Together
We recently wrote about using Looker Looks as models in Census. Census and Google work closely together to help mutual customers accelerate action from data with reverse ETL and Operational Analytics.
Census integrates with multiple Google products that power your business. Supercharge your entire Google stack with Census:
- GCP BigQuery (source)
- Google Sheets (source)
- Google Ads (destination)
- Google Offline Conversions (destination)
- Google Sheets (destination)
- Google Cloud Storage (destination)
Check out all of our other connectors.


