Every day, petabytes and petabytes of data are collected, operated on, and stored for a vast range of analytical purposes all across the world. Without pipelines to get this data and use it properly, large scale data science simply wouldn’t be possible. Traditionally, one of two processes, dubbed ETL and ELT, were used to grab large amounts of data, pick apart the bits that mattered, and then load these into a data lake or data store. However, both of these pipelines have their drawbacks, and in 2020 - as the world becomes ever more dependent on analytics and real time data - ETL and ELT simply aren’t the sharpest swords anymore.
In this article, I’m going to compare ETL and ELT, summarizing how each works, how they’ve been conventionally used both in the past and today, and why most leaders in data science think they’re obsolete.
ELT, ETL, What’s the difference?

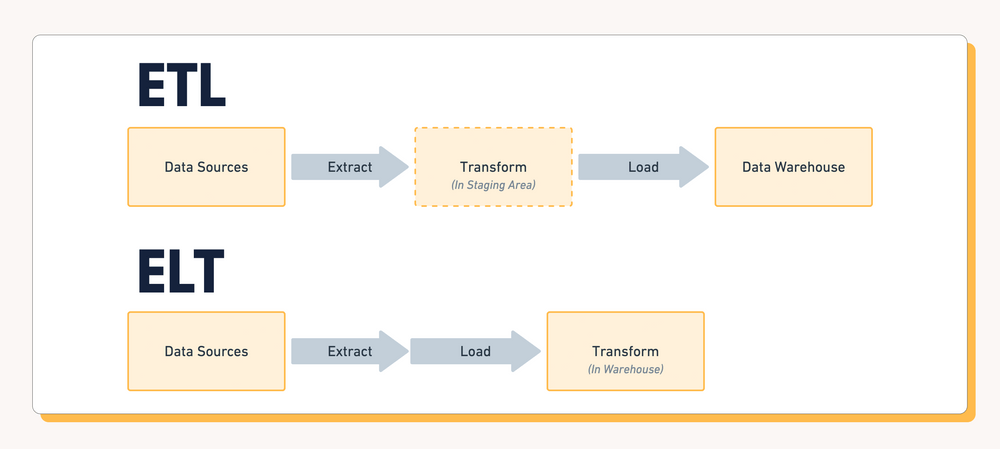
ELT stands for Extract, Load, Transform, while its partner ETL similarly signifies Extract, Transform, Load. These three steps are crucial processes in any important data transformation. Whether you realise it or not, they’re used in millions of applications all across the globe. Every time you purchase an item from your nearby grocery store, your transaction, whether it be anonymous or identified, will be shuffled down one of these pipelines for financial and marketing analytics. Let’s see how ELT stacks up against ETL.
If we’re collecting data from various sources, such as multiple stores across a country, or let’s say, many different instruments at different points on a water dam to give a scientific example, we need to gather all this data together, and then take only the parts that matter to the analytics we want to create. This could be the net sales from each store, and in that case, you’d need to normalize and total up all the transactions. Or, in the dam example, it could be all the water pressure readings that need to be listed. This is the transform process, and it is essential for creating analytics. Specifically, it is what allows us to use business intelligence tools like Tableau or Periscope.
When we’re using ELT - that is Extract, Load, Transform - our intention is to save our primary machine from performing all these computationally expensive operations, by doing them on a data server instead. Instead of using the grocery store’s computer to total up the transactions, we send the raw data to a data lake or other storage machine, and only then do we enact the transform stage to get the overall profit - adding up transactions and subtracting costs, for example.
ELT is great for large amounts of data where we’re just doing simple calculations, such as the grocery store example. We can extract the data from all our sources, eg. the card readers, load them into our data storage, and then transform them so we can easily conduct analytics.
On the other hand, you have ETL. This works better with the dam example. In total we don’t collect a lot of data necessarily, but there are many different kinds of readings, and it’s likely you’ll want to perform lots of calculations on it for insightful analytics. Preferably we also want this data real time, so we can prevent any floods! In this case, Extract, Transfer, Load is better suited. Instead of sending our raw data to a data storage and then doing our operations, we perform them as they are being sent to the data storage, in what is called “transformation stages”. This way we can establish a continuous stream of data that is being processed before it is even loaded into the data storage!
These two analogies are good at highlighting the advantages and disadvantages of ETL vs ELT. With ELT, it’s great when you have a ton of data, such as hundreds of transactions, but you only want to perform some relatively simple operations, like calculating profit, or mapping sales to time in the day.
Meanwhile, ETL works better for real time cases where we don’t have tons of data, but we do have lots of specialized data that needs to be sorted properly, and therefore more calculations are needed.
Tools for ETL and ELT
Luckily for the modern world, we don’t have to do a ton of programming to create a streamlined pipeline for our data anymore! There are many ETL and ELT tools that allow us to perform these functions, from a wide variety of data sources to an extensive range of data warehouses or machines.
For example, the Hevo no-coding data pipeline is popularly used among retailers and other physical businesses who want to collect sales data, or activity information about their stores. But it’s also great for real time data too, so if you want to measure the foot traffic outside your storefront and map that over time, you can use Hevo too!
There’s also Fivetran, which is built around pre-built connectors and functionality for a “plug and play” experience.
dbt - a better approach!
ELT and ETL might sound like perfectly reasonable methods to use to get data from A to B for analytics, but they’re actually both pretty inconvenient on their own. With ELT and ETL, you have to know exactly what analytics you want to create before loading your data. Luckily, they’re quite trivial with modern tools like Fivetran, Airflow, Stitch, etc, and cloud warehouses like BigQuery, Snowflake, and Redshift.
Even then, the hard part still remains in the transform layer. The transform layer is a crucial element in your data pipeline but if it’s bottlenecking you from getting the most relevant insights, then there must be a better way.
With some more advanced pipeline techniques however, we can increase our options and allow us to create many different kinds of analytics without having to resend data through the pipeline and keep doing different transformations on it!

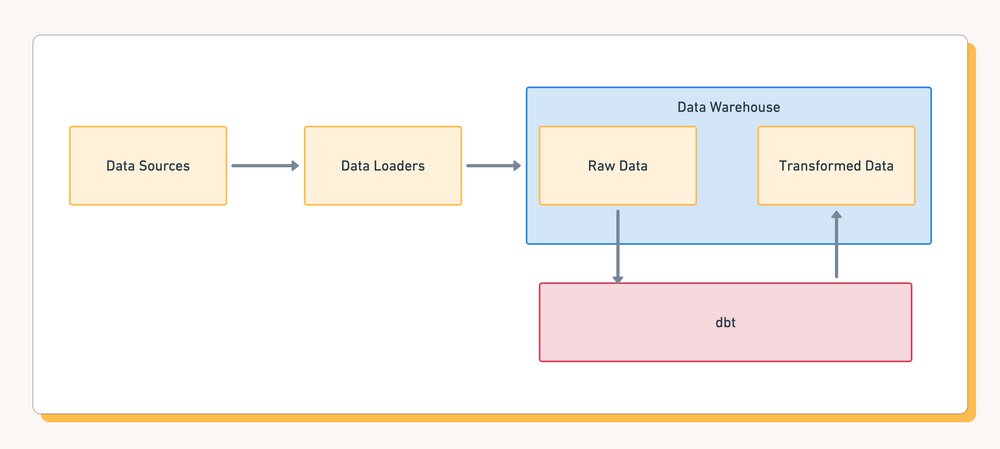
It’s called dbt, or Data Build Tool, and it’s a super flexible command line data pipeline tool that allows us to collect and transform data for analytics really fast, and really easily! There’s no need with dbt to completely reprogram your pipeline.
dbt is still built on SQL like conventional databases, but it has additional functionality built on top of it using templating engines like jinja. This effectively allows you to bring more logic (i.e. loops, functions, etc.) into your SQL to access, rearrange and organise your data. Kind of like programming your dataset but with much more flexibility and options.
With this code, you can then use dbt’s run command to compile the code and run it on your SQL data to get exactly the parts you need in the transformations you’re looking for. It can also be quickly programmed, tested, and modified without huge waiting times for it to run through all your data, meaning you can create new, better versions of your programs on a tight schedule.
dbt does not entirely replace ELT and, but it does allow for significantly more flexibility - it super boosts your “T”ransform layer/stage. With dbt, you can aggregate, normalize and sort the data again and again, however you like, without constantly updating your pipeline and resending.
dbt isn’t a replacement for ETL and ELT, but these pipeline methods stand-alone are becoming obsolete with modern technology taking its place. Whether you follow ETL or ELT, one thing for sure is that dbt is such a big improvement for the T(ransform) layer in every way that you can think of.
So what’s next?
I encourage you to take dbt for a spin. You can start with the quick start guide here and join their super helpful community here. Trust me, when you start using dbt, you will wonder how you did any data modeling work before.
And after that? Check out our reverse ETL dbt integration to turn your models into reality inside all of your operational tools.
Do more with your dbt models than just reporting and start syncing for free today with Census.


